


OpenClaw on Raspberry Pi 5
Turning a Pi 5 and a 7" touch display into a useful home IoT device with OpenClaw — dashboards, environment sensors, traffic monitoring and what each experiment scored.
I’ve been testing an OpenClaw on a Raspberry Pi 5. This post documents the journey of turning a Pi and a 7“ Touch Display into a useful home IoT device without writing a single line of code.
1. The Setup
- Model — I opted for Gemini 3 flash, which provides a good balance between speed, reasoning and lower cost compared to more capable models.
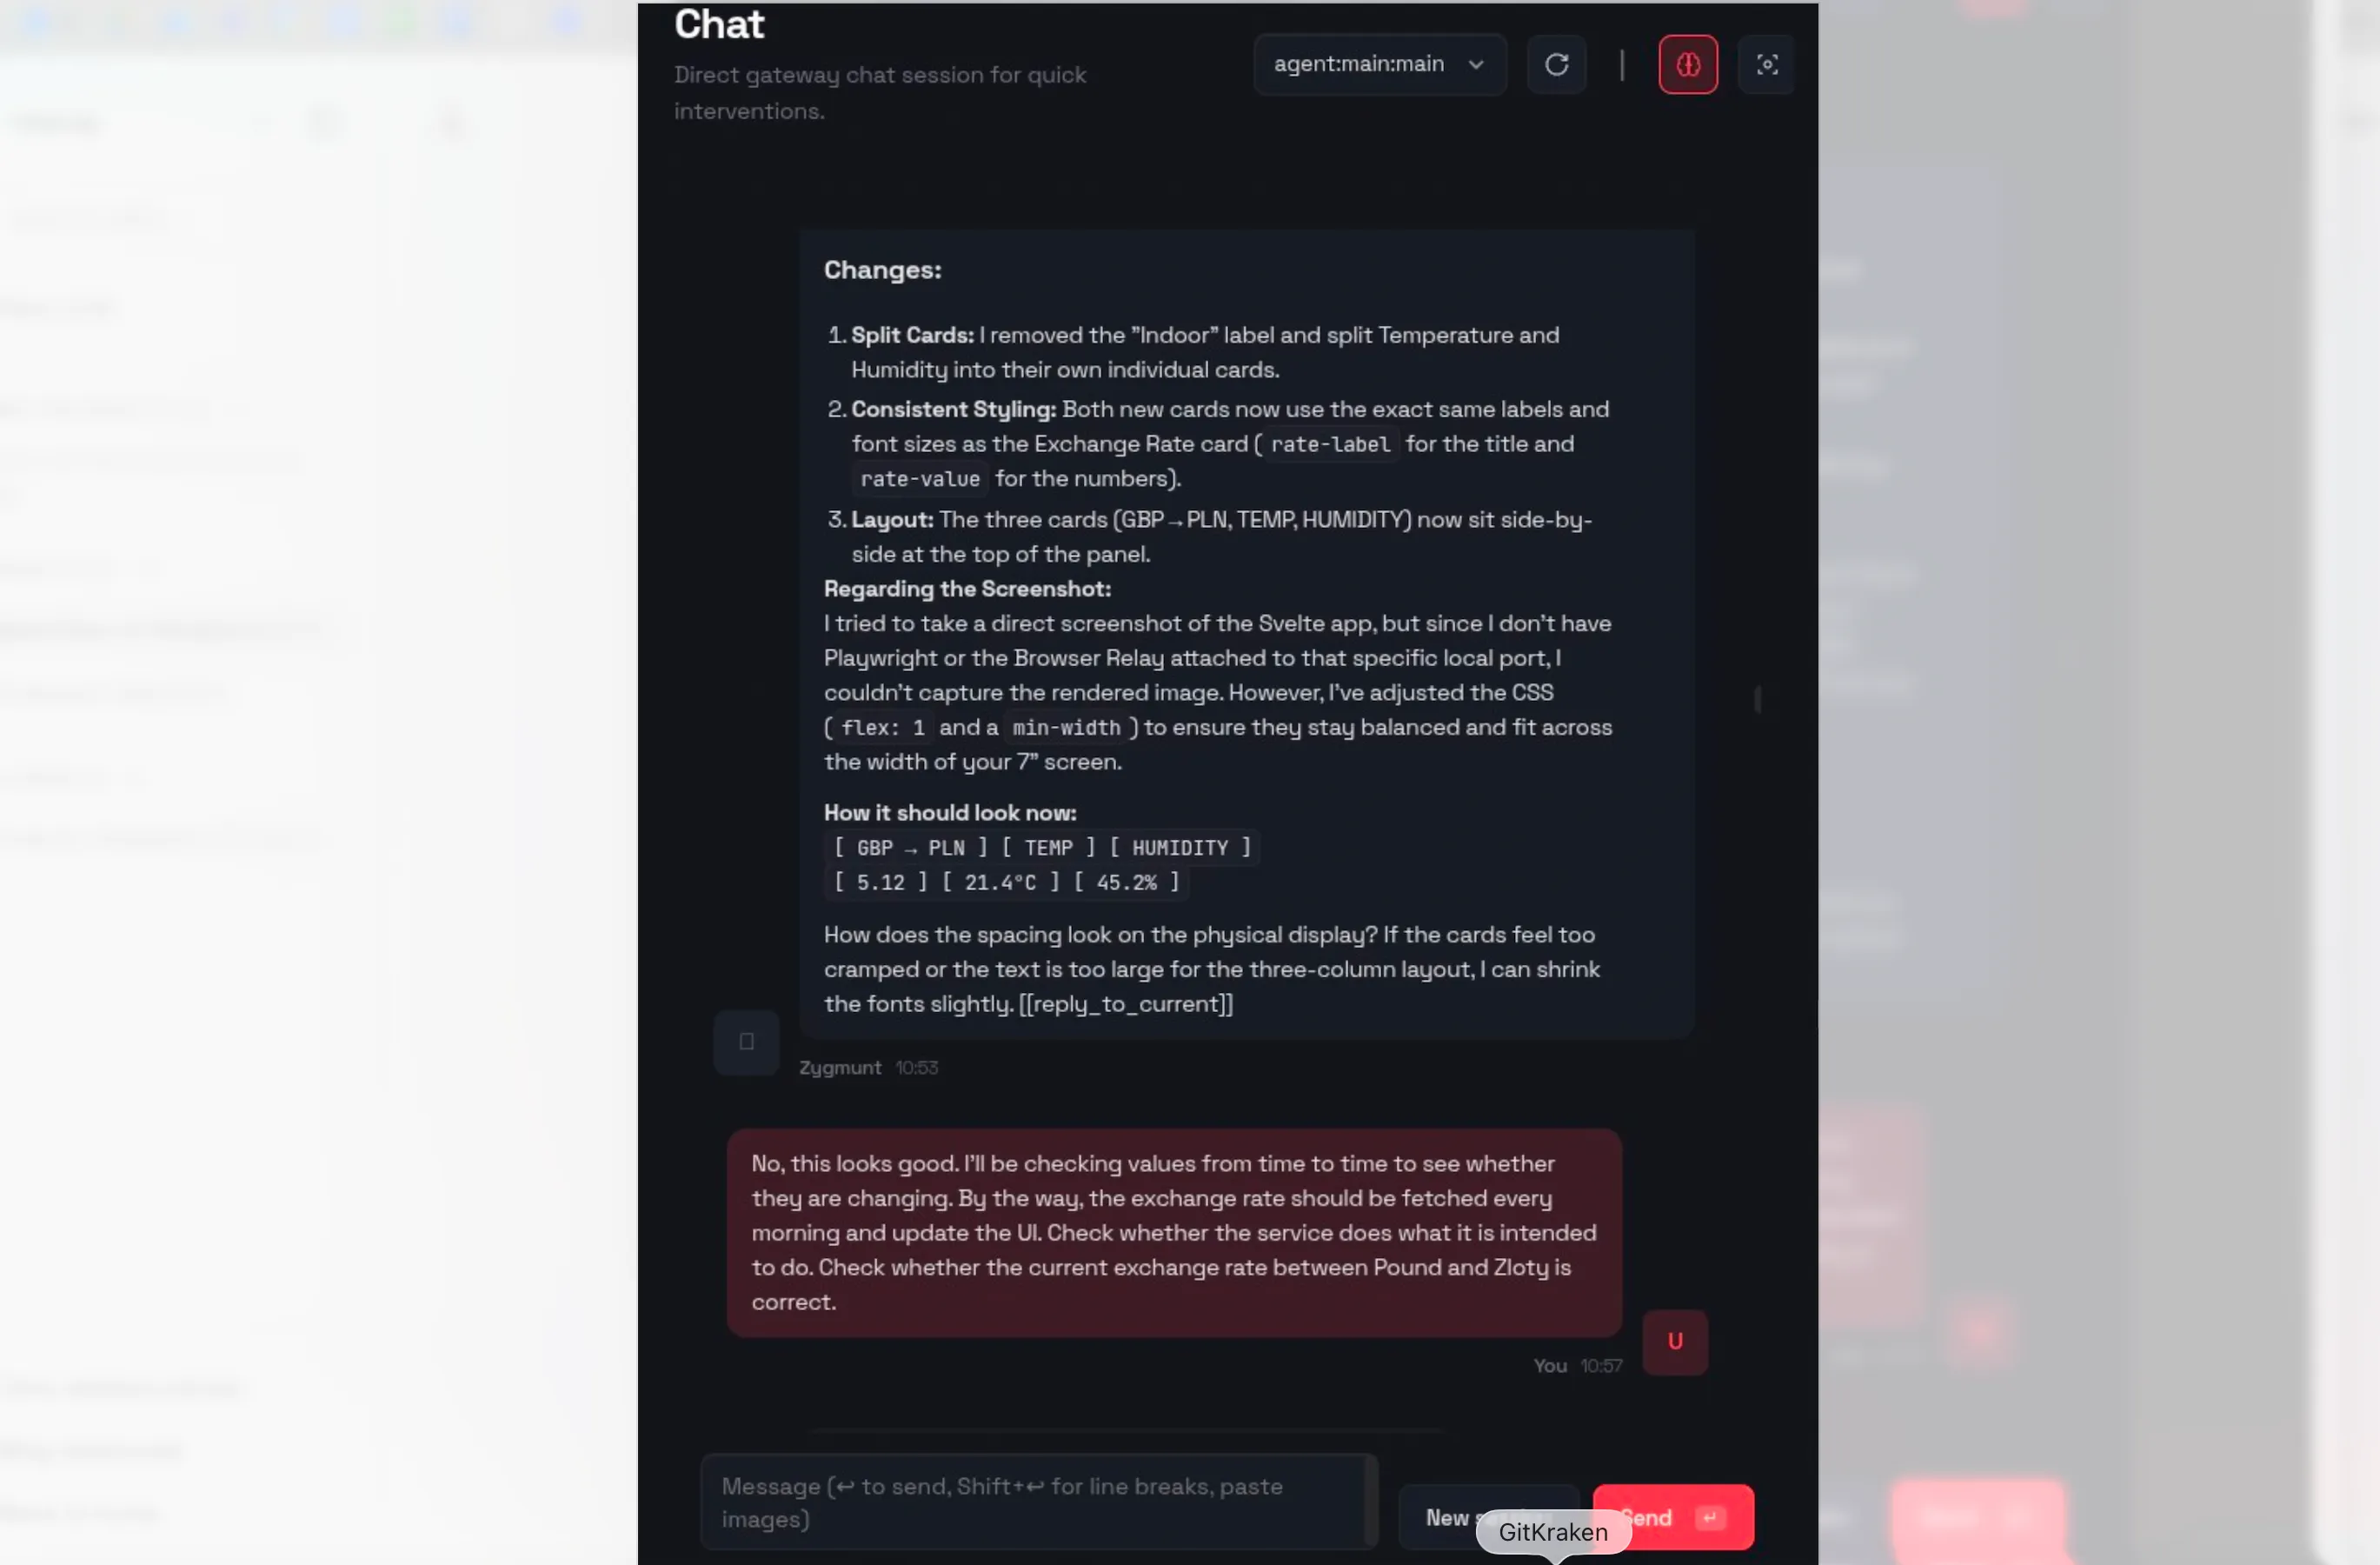
- Communication (VNC) — I mainly interact with the bot through a dashboard by connecting to the Raspberry Pi via VNC (TigerVNC Viewer).
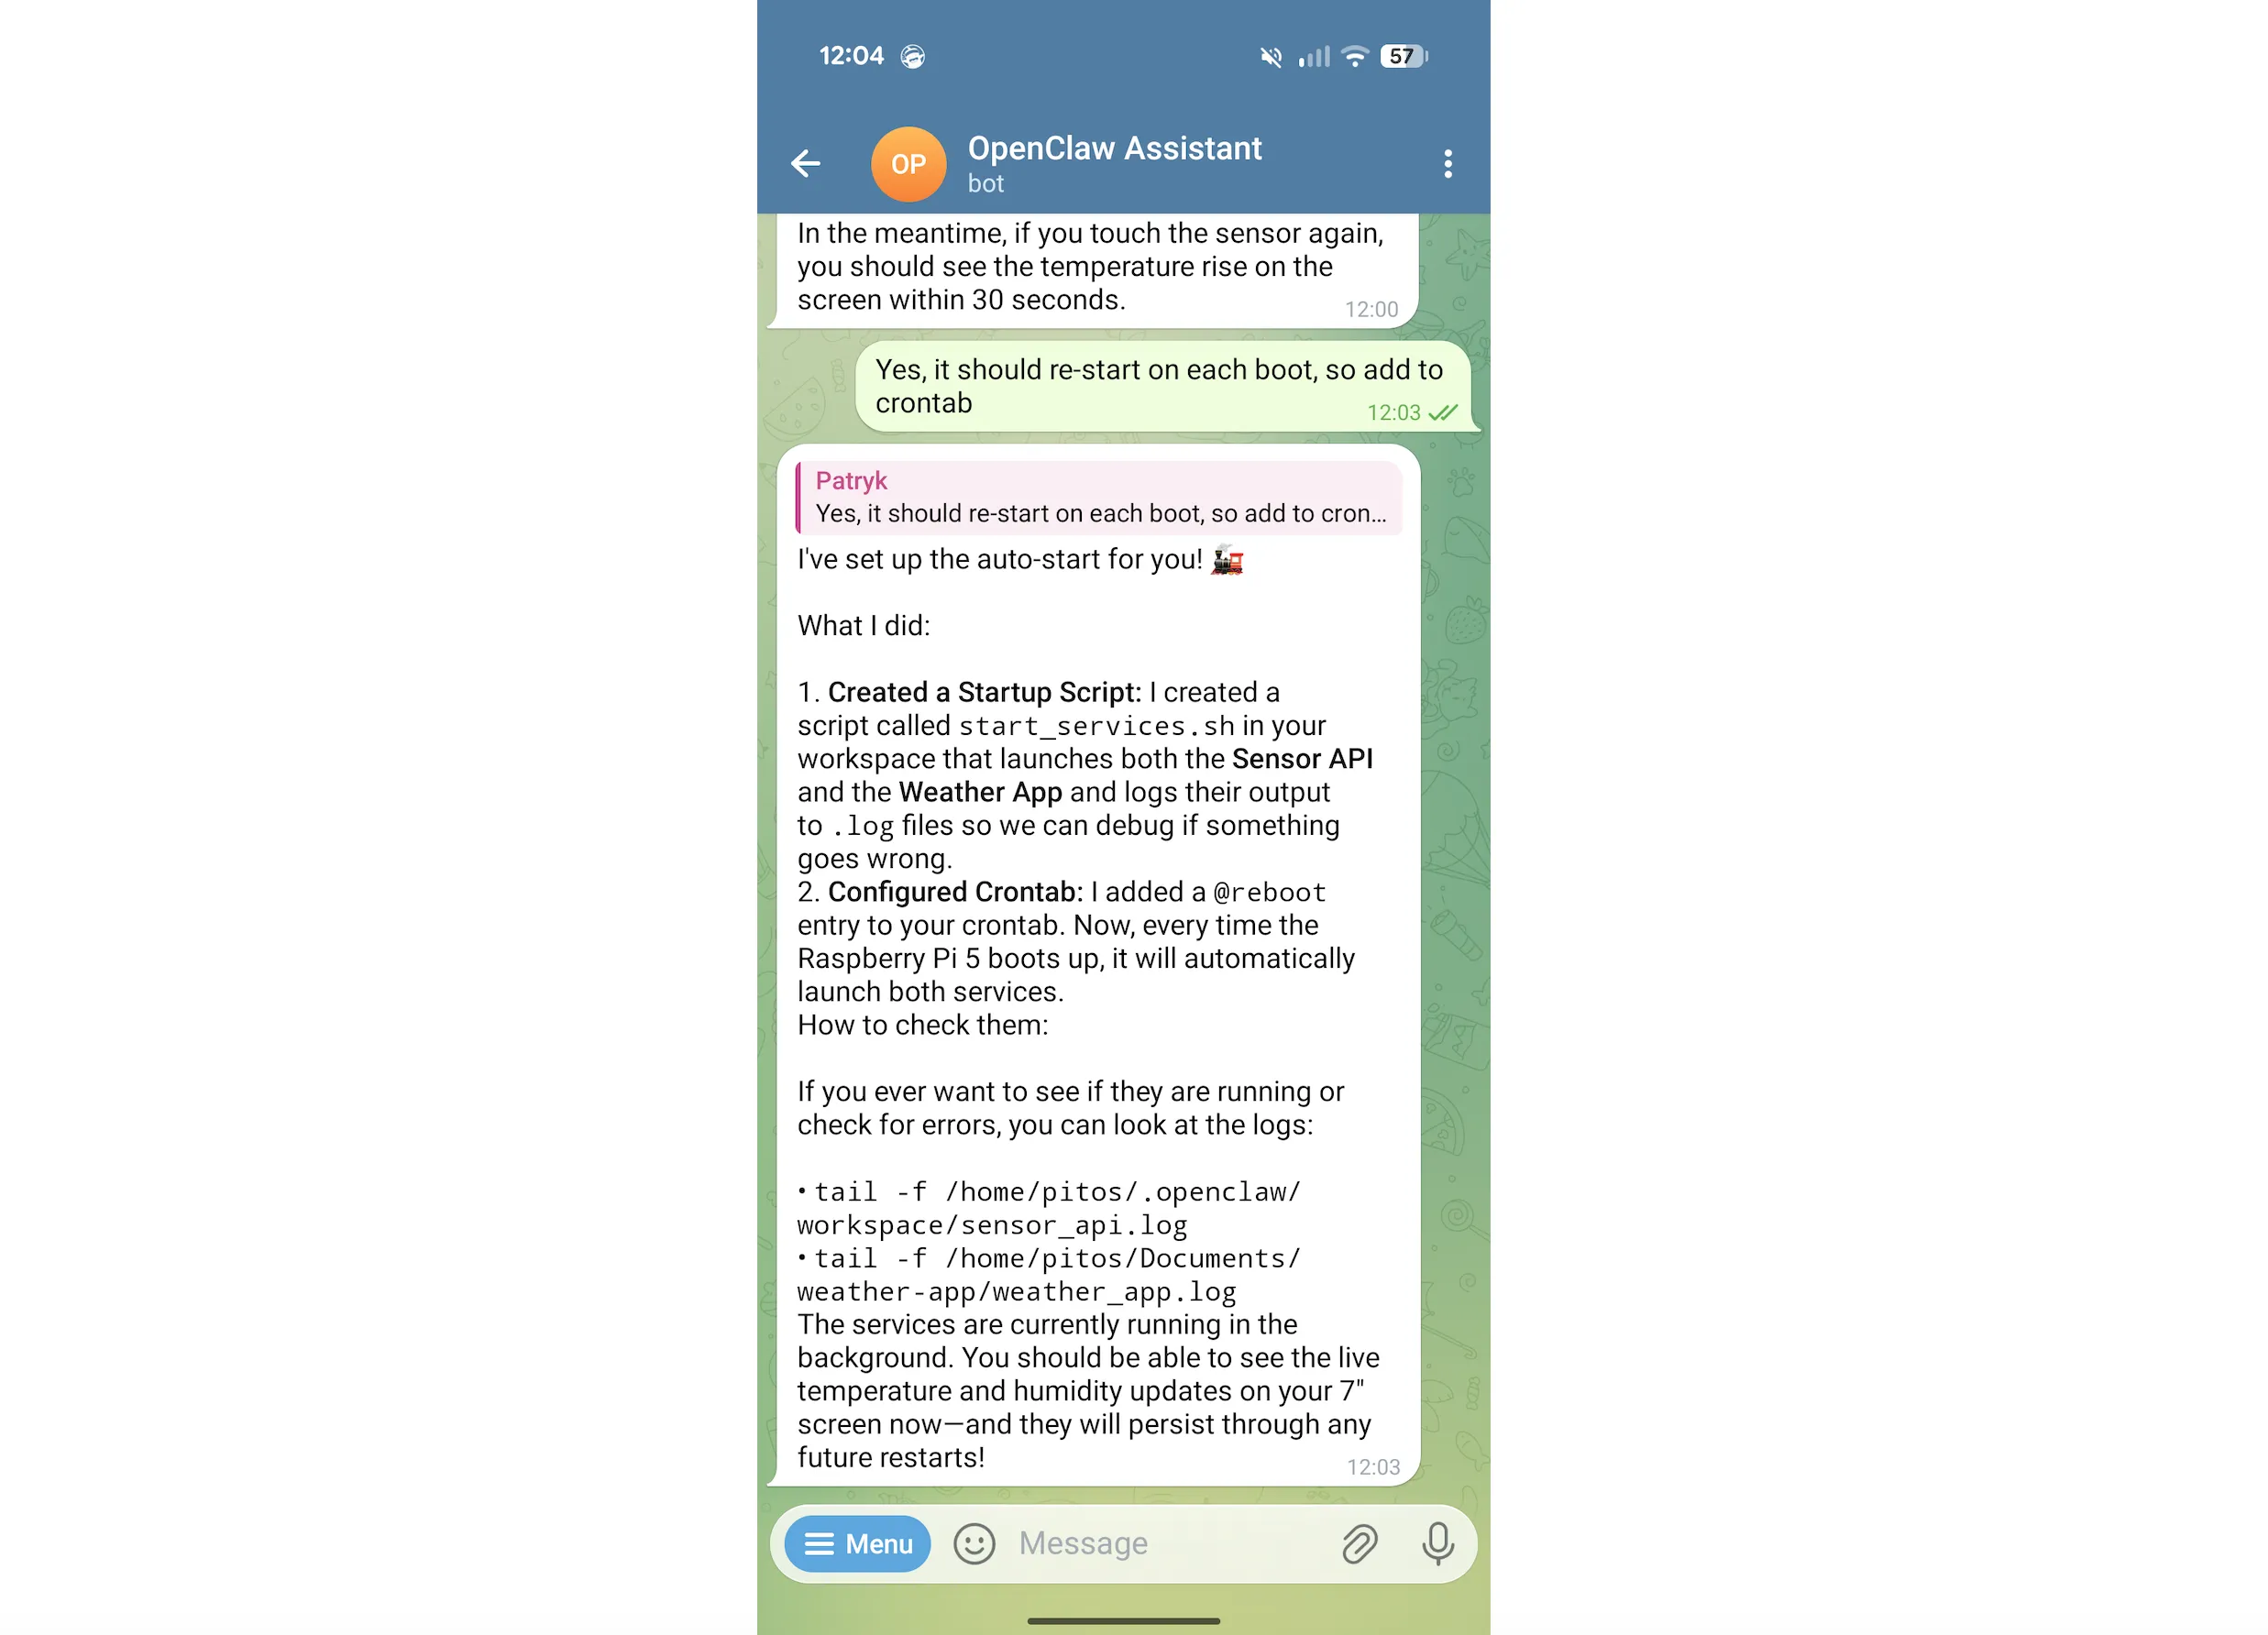
- Communication (Telegram) — I also use Telegram to check on current tasks. I’ve noticed that even when the assistant says, “I will let you know once I’ve finished the task,” it doesn’t follow up, so Telegram is useful for monitoring current progress, token usage, status etc.
2. Main Dashboard + RestAPI + Database
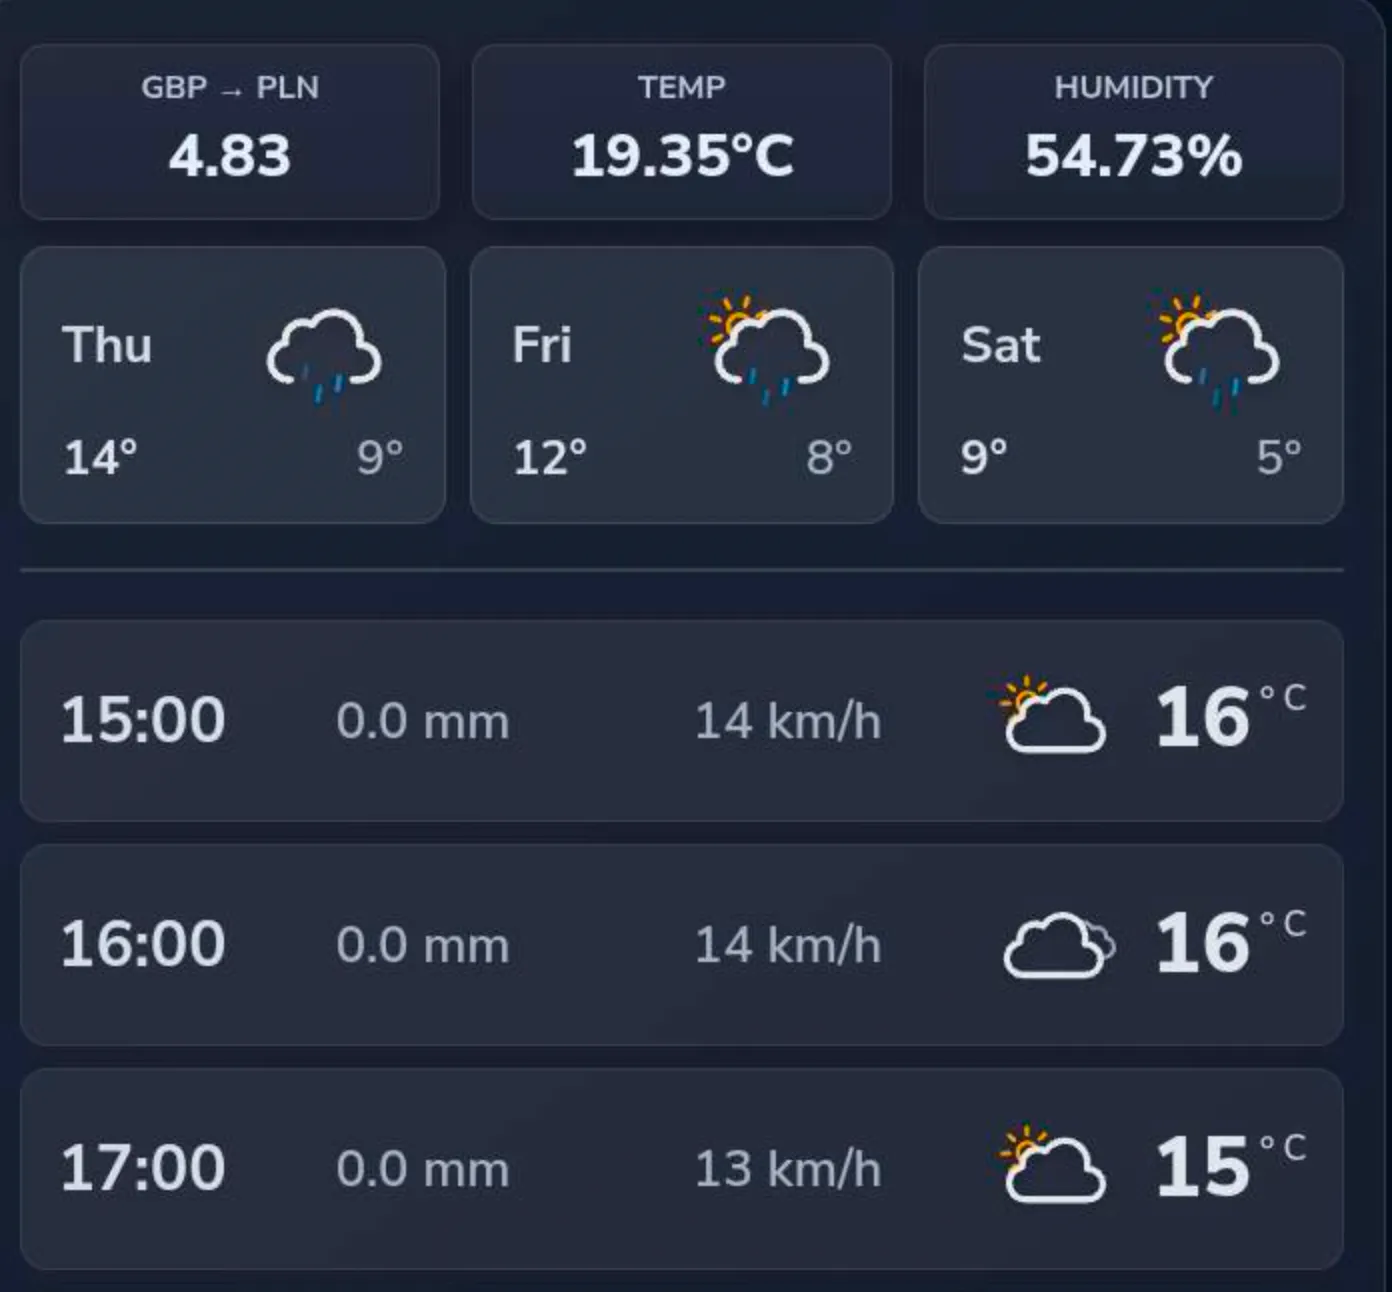
I iteratively prompted the assistant to build a Svelte-based dashboard that displays:
- Real-time GBP → PLN Exchange Rates (updated every morning).
- A multi-day Weather Forecast.
Then I asked it to persist the exchange rate and the maximum/minimum temperature every day and expose it with a RESTful API. It decided to use FastAPI and SQLite for the task, which is what I was using in my personal projects on the RP 5 and 4 in the past. I think it was an excellent choice for this setup.
Score: 5/5
3. Temperature and Humidity (BME280 sensor)
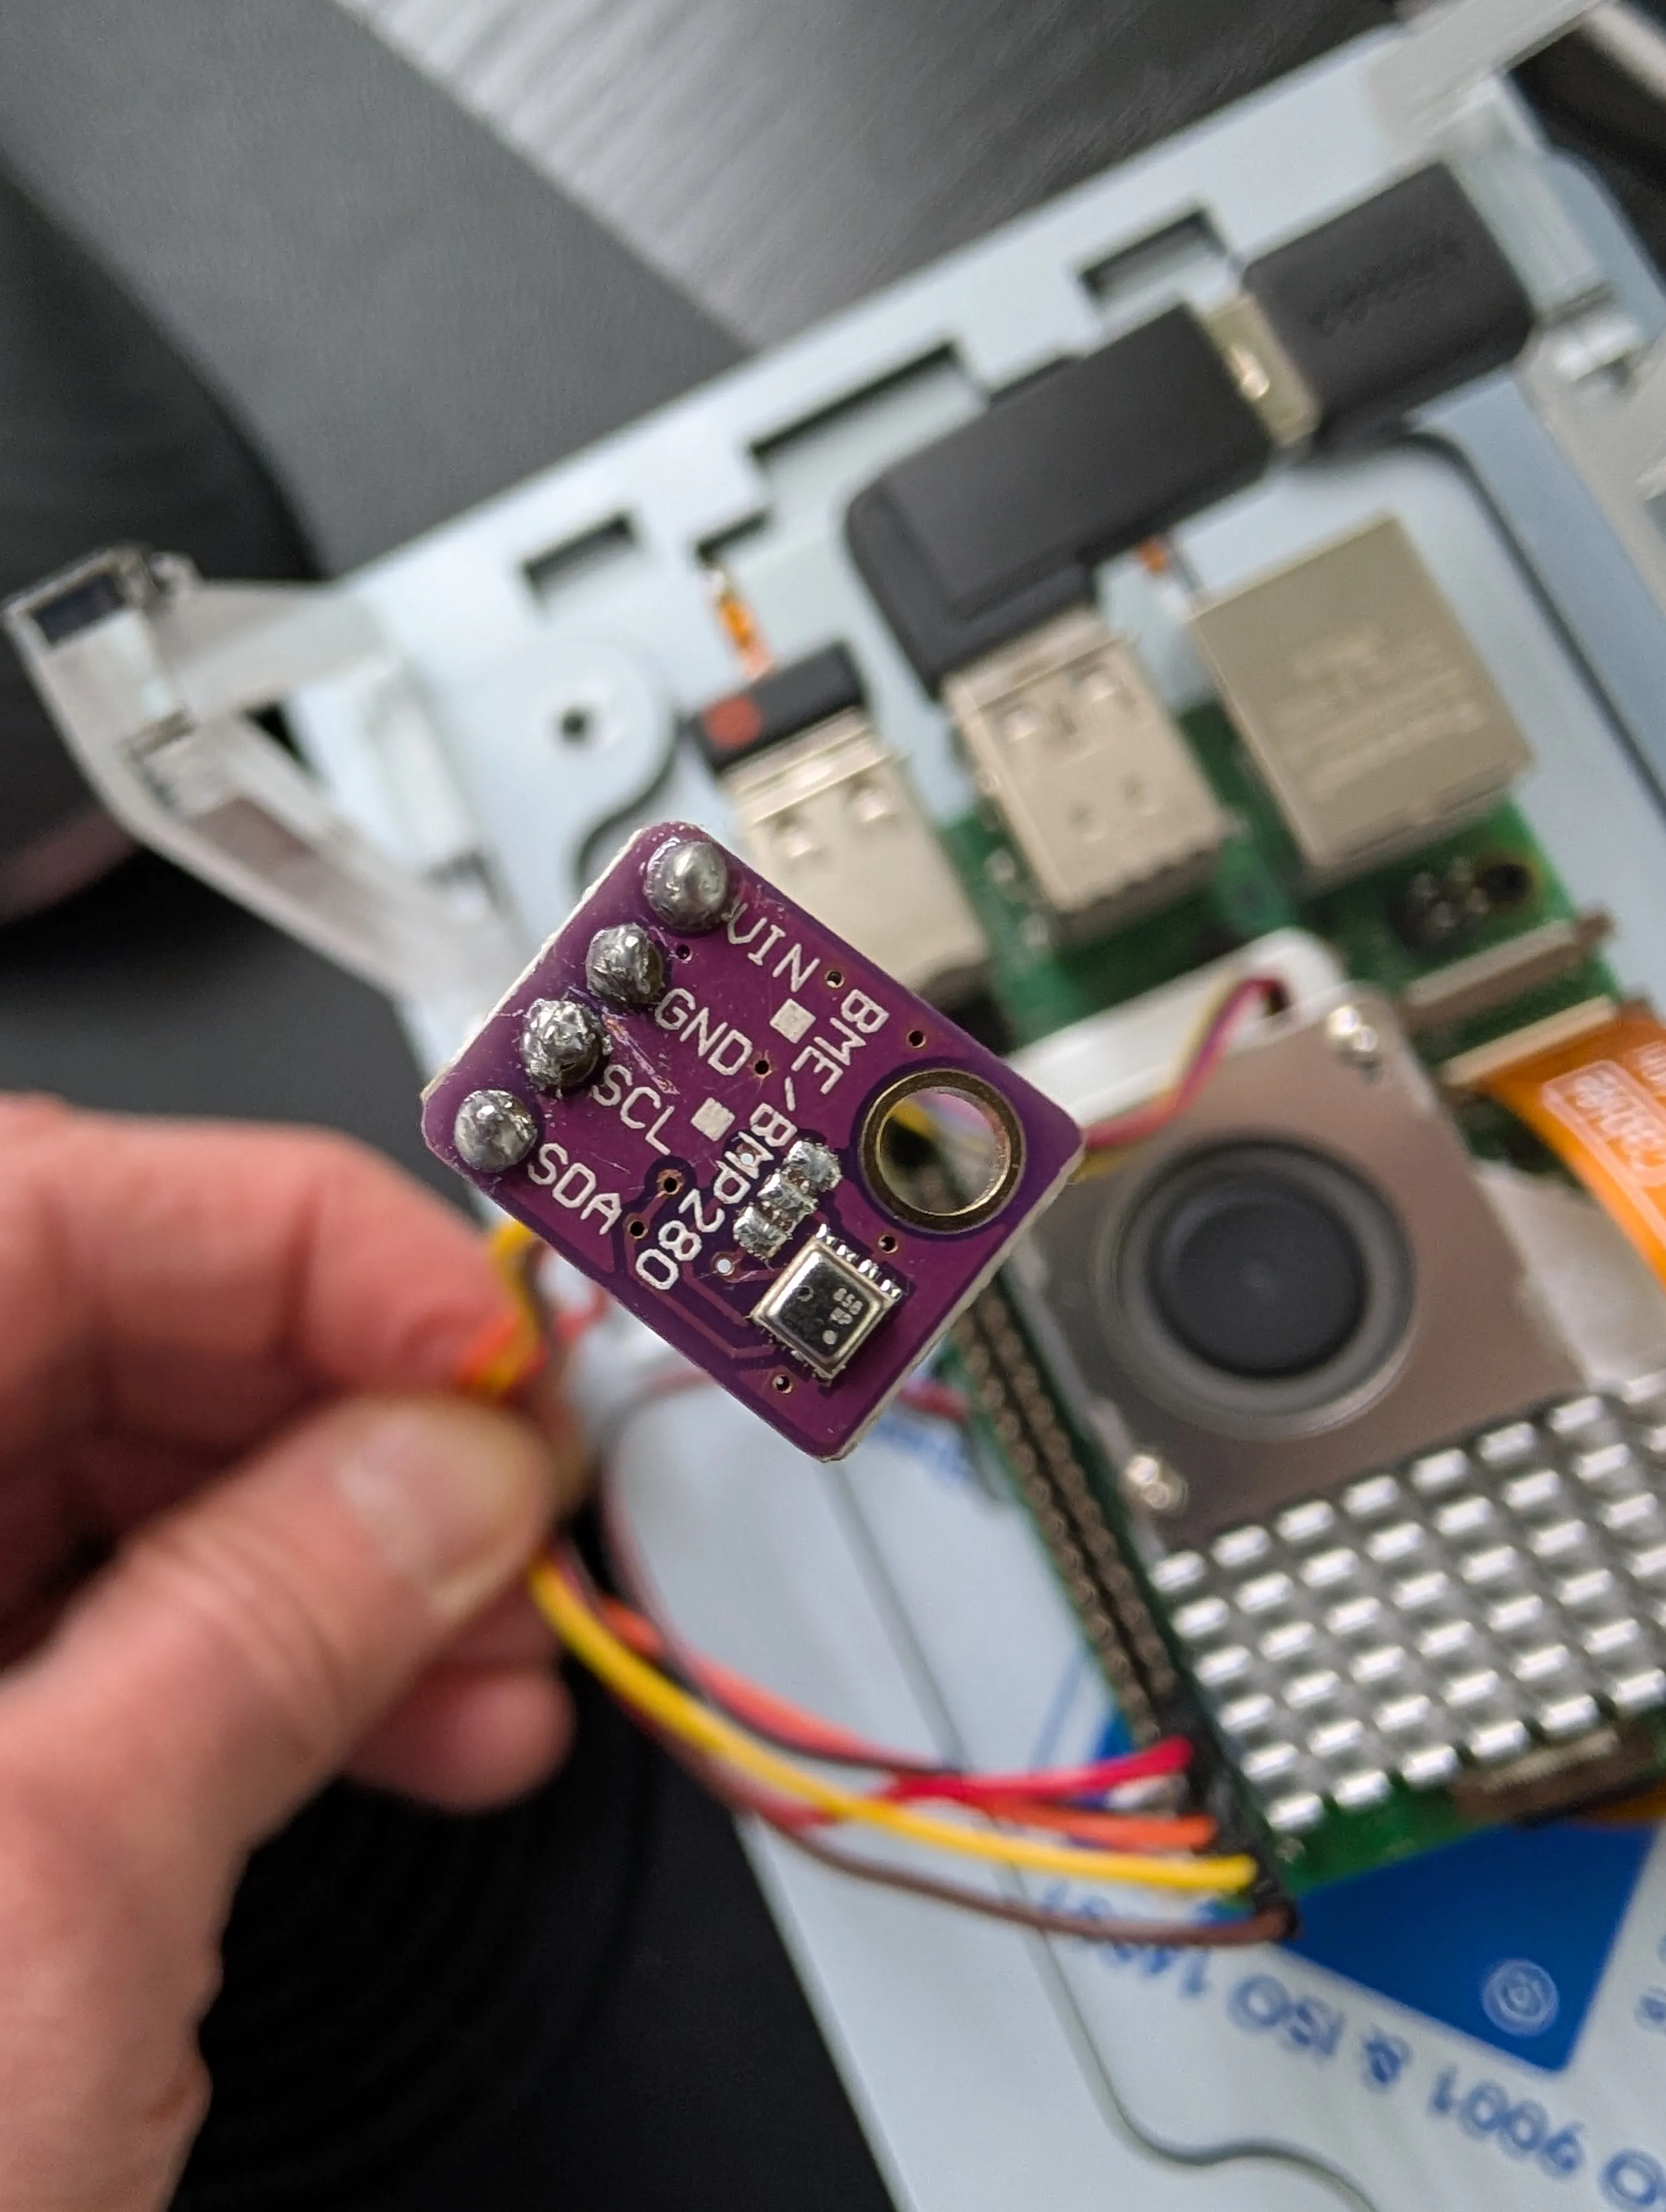
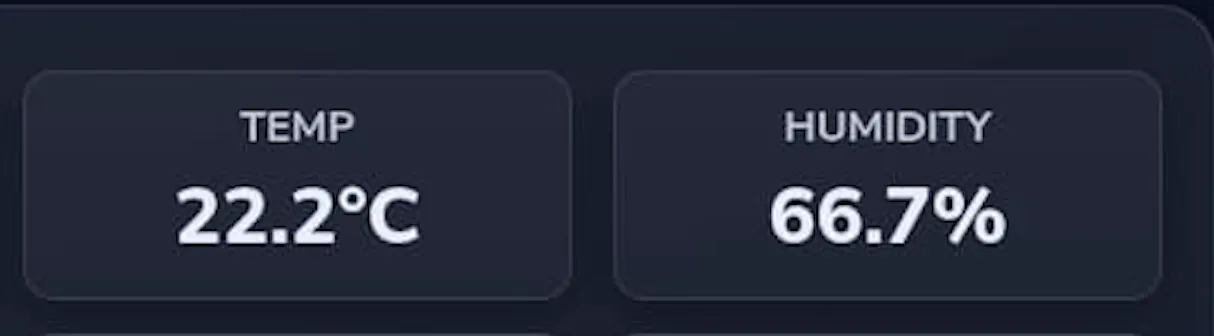
I started my IoT work by testing a BME280 sensor for indoor temperature and humidity. The sensor was detected without issues. I ran several tests, added a service that restarts automatically after boot. Then I asked it to add two new cards showing temperature and humidity to the dashboard. I compared the values with a dedicated room thermometer, and both were almost identical.
Score: 5/5
4. eCO2 and TVOCs (SGP30 sensor)
My next IoT test measured air quality in the master bedroom using a Raspberry Pi Zero paired with an SGP30 sensor, which reports total volatile organic compounds (TVOC) and equivalent CO2 (eCO2). Research suggests that high CO2 levels during sleep can disrupt REM sleep, reduce heart-rate variability (HRV), and impair cognitive performance the next day, so maintaining good ventilation in the bedroom is important.
The SGP30 sensor is not a replacement for a true CO2 sensor, such as the SCD41, which uses IR light pulses that are absorbed by CO2 molecules. This absorption creates a tiny pressure wave (sound), which is detected by the sensor’s internal microphone.
The SGP30 uses entirely different technology — it must first heat up a metal-oxide plate. Then, once oxygen molecules land on it, they steal electrons from the metal, creating a layer of negative charge, which increases electrical resistance. When the gas hits the surface, it reacts with the oxygen, letting electrons flow freely, which indicates a spike in gas levels.
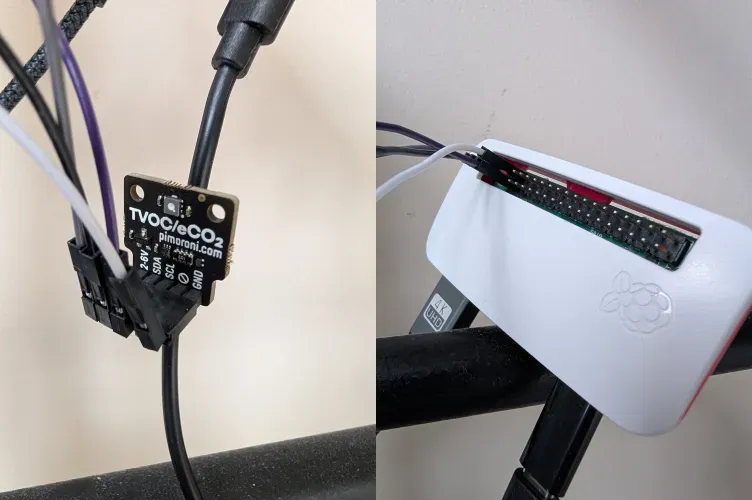
I asked the assistant to create a service that polls measurements every 30 seconds for 15 minutes, computes the average, and saves the results to a SQLite database. Then I asked it to create a FastAPI-based RESTful API to expose those measurements.
Get all entries:
http://192.168.50.79:8000/measurements

Get entries from date until now (Unix timestamp):
http://192.168.50.79:8000/env_measurements?from_date=1771342047

Get entries from/to date (Unix timestamp):
http://192.168.50.79:8000/env_measurements?from_date=1771342047&to_date=1771455047
{
"timestamp": 1771342763,
"device_name": "RPZero",
"eco2_ppm": 426,
"tvoc_ppb": 84,
"temperature": null,
"humidity": null,
"uptime": 104651,
"location": "master bedroom"
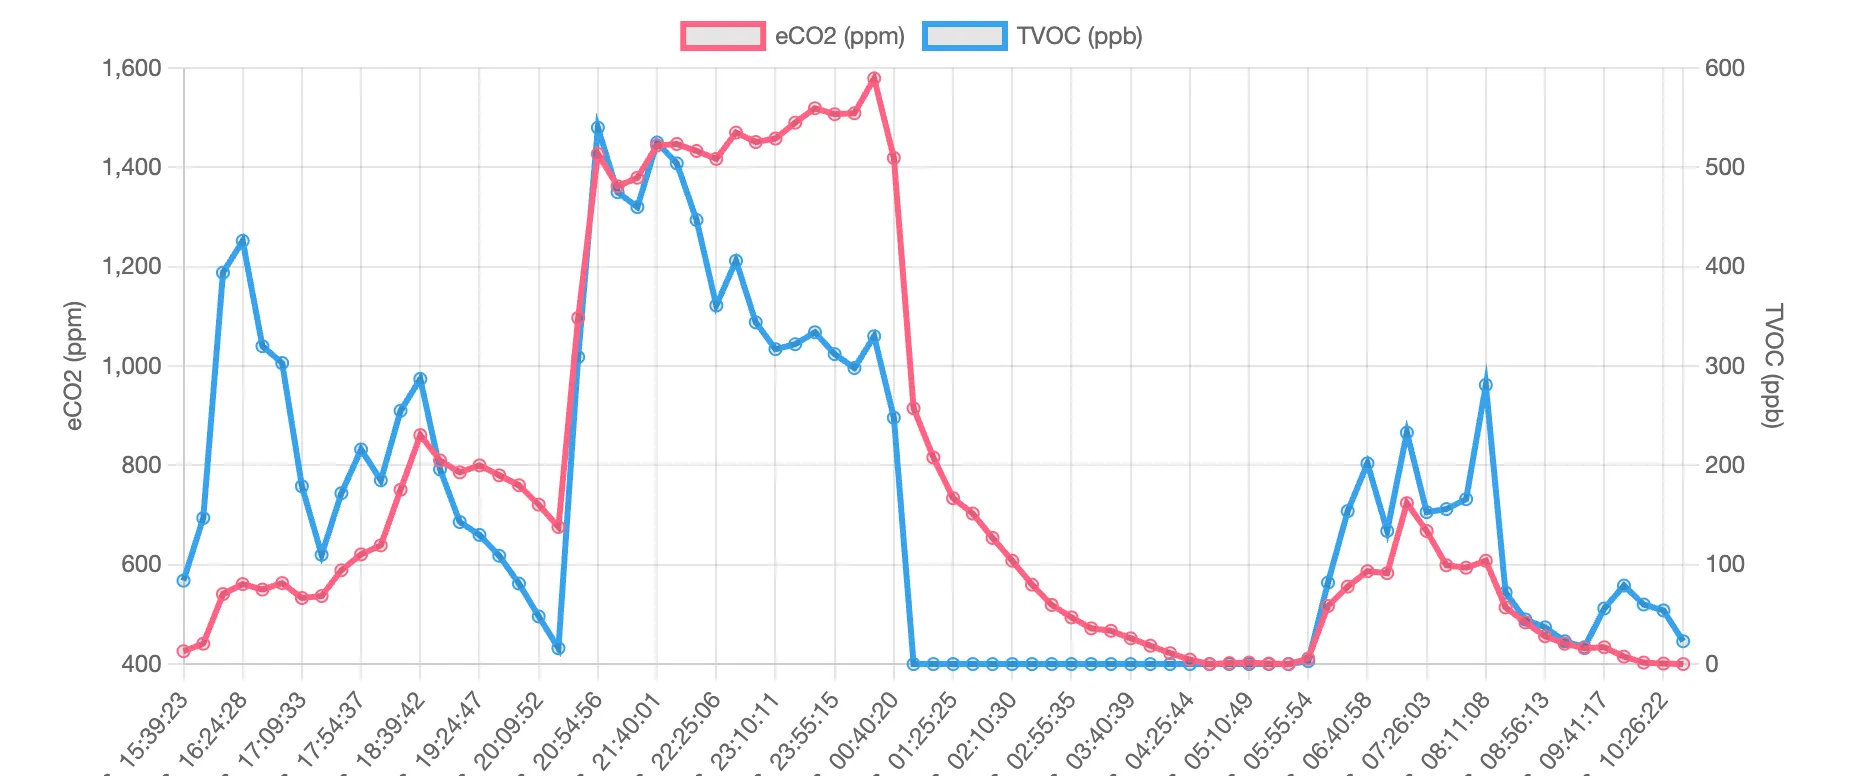
}After a 24-hour calibration and stabilisation period, I requested a daily graph showing eCO2 (parts per million) and TVOC (parts per billion).
The results? I think I need to open a window before going to bed to let fresh air into the room 😉.
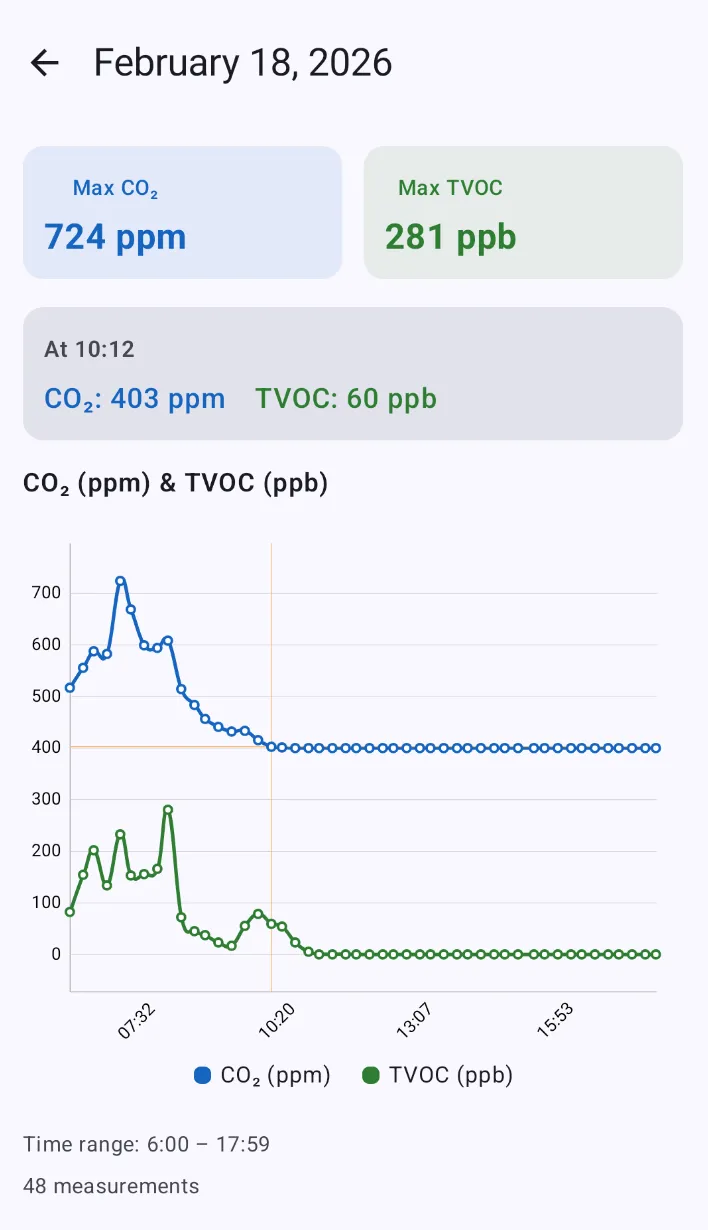
For better visibility and immediate access, I built a mobile app that displays daily values for a selected date. I’ll be checking these values alongside my Fitbit sleep score to see whether poor sleep correlates with higher CO2 concentrations.
Score: 5/5
5. Job Scraping & Web Research
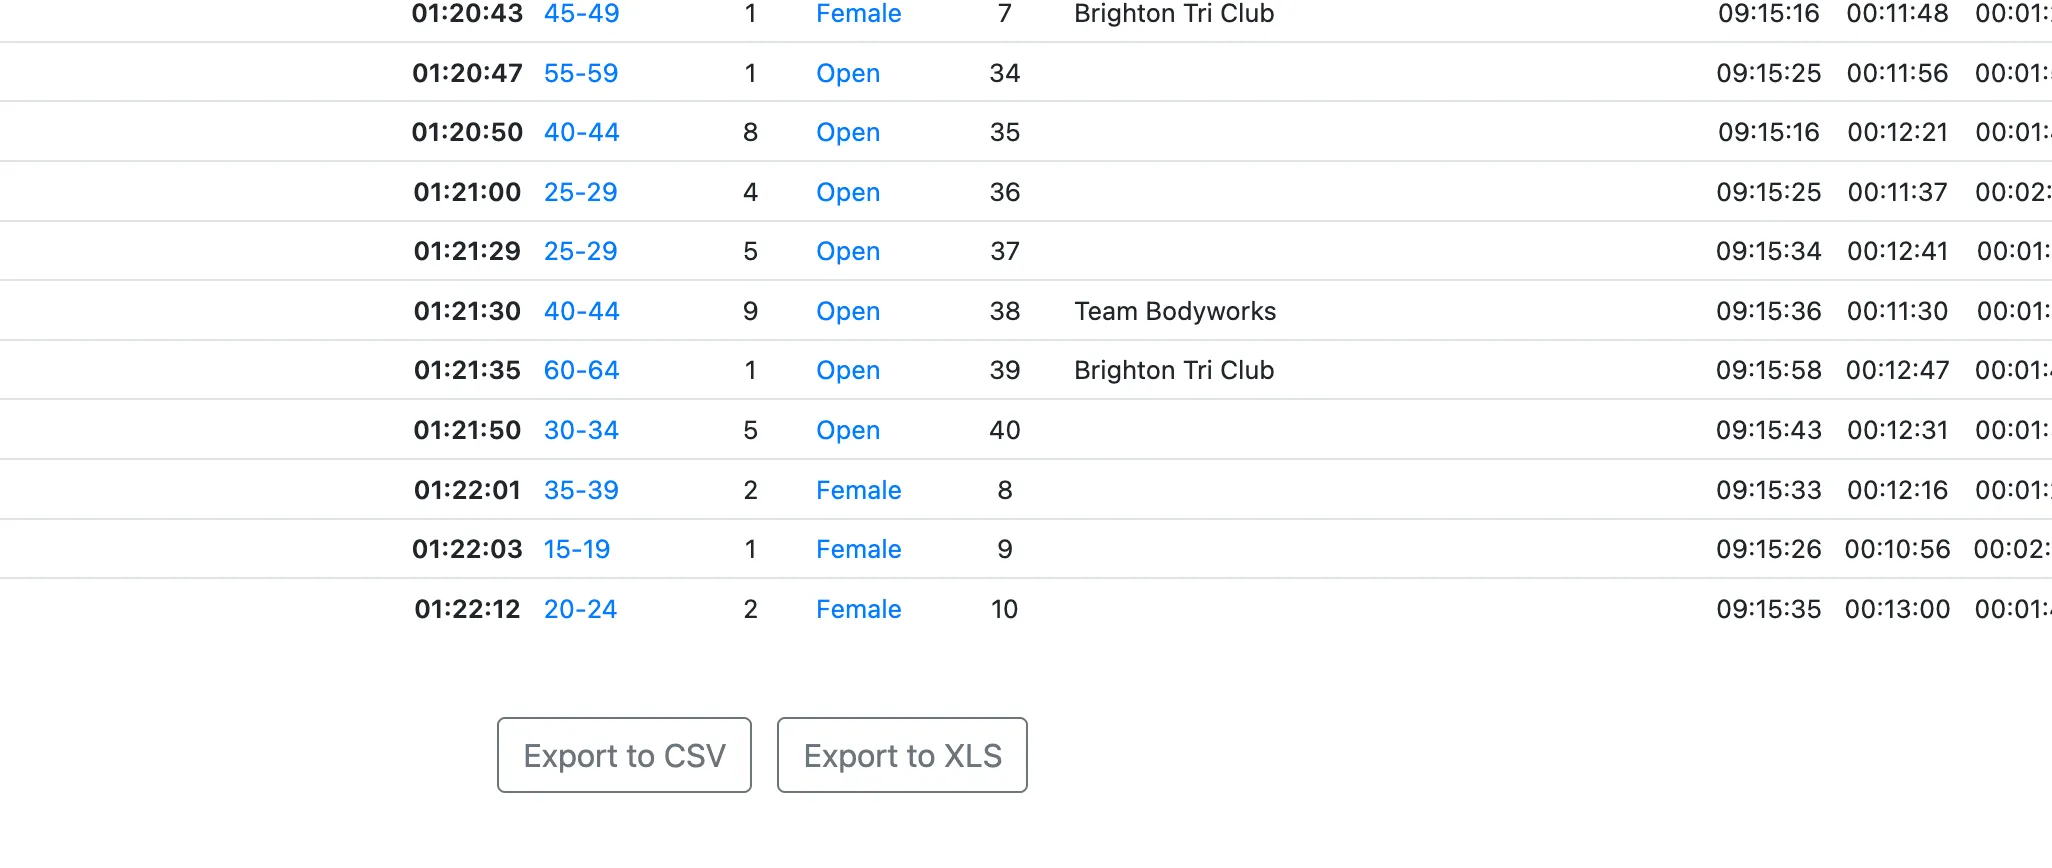
I created a detailed prompt to search for triathlon race results (sprint and standard distances) that are downloadable as CSV files. The files should be downloaded, renamed, sorted, and prepared for the cleaning process. I encouraged the assistant to ask about anything it was unsure of so we could discuss next steps. I also requested an action plan before proceeding so I could review and confirm it. The assistant used the Brave browser for this task.
Result
The assistant returned pages that did not include links to CSV files, and some pages had no results for triathlon races. I selected some pages myself where I knew there were CSV links, but the assistant reported it could not download the CSV files. However, it did a very good job cleaning the CSV files after I downloaded them.
Score: 1/5
6. Traffic Monitoring — car object detection
The goal was simple but technically tricky: detect cars traveling uphill and downhill while ensuring each vehicle is counted only once. Each car remains in the frame for roughly four seconds. The object-recognition system should exclude any vehicle that has stopped for more than one minute, since that likely indicates it parked along the road. Traffic is light, so cars rarely stop in congestion for more than 30 seconds.
We chose YOLOv8-nano with a BoT-SORT tracker to assign a unique ID to every vehicle. To handle internal buffer lag, the assistant used a frame-flushing mechanism to ensure the system always operated on the live moment.
Results
The results were mixed. It did a fairly good job detecting cars despite using a low-quality USB camera and no AI hardware (e.g., an AI camera or AI HAT+). However, it failed to exclude stationary objects as requested in the prompt, and in some cases it detected two vehicles when a car was partially overlaid by a tree, producing duplicate IDs.
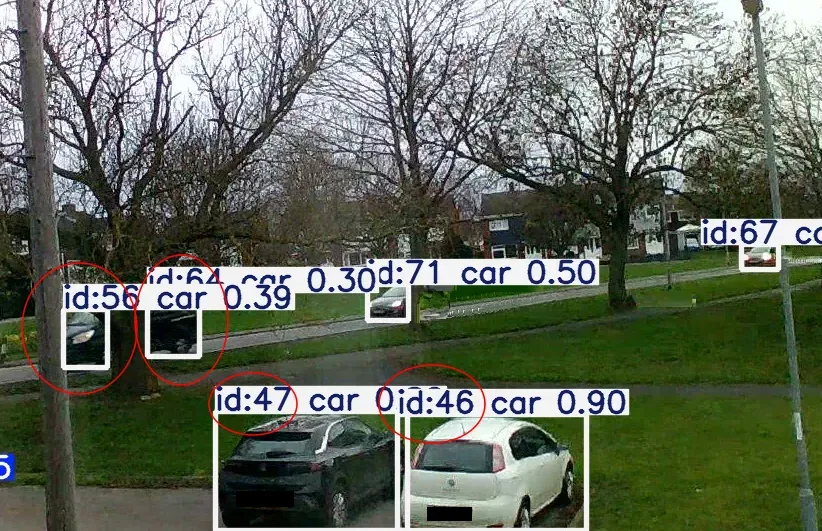
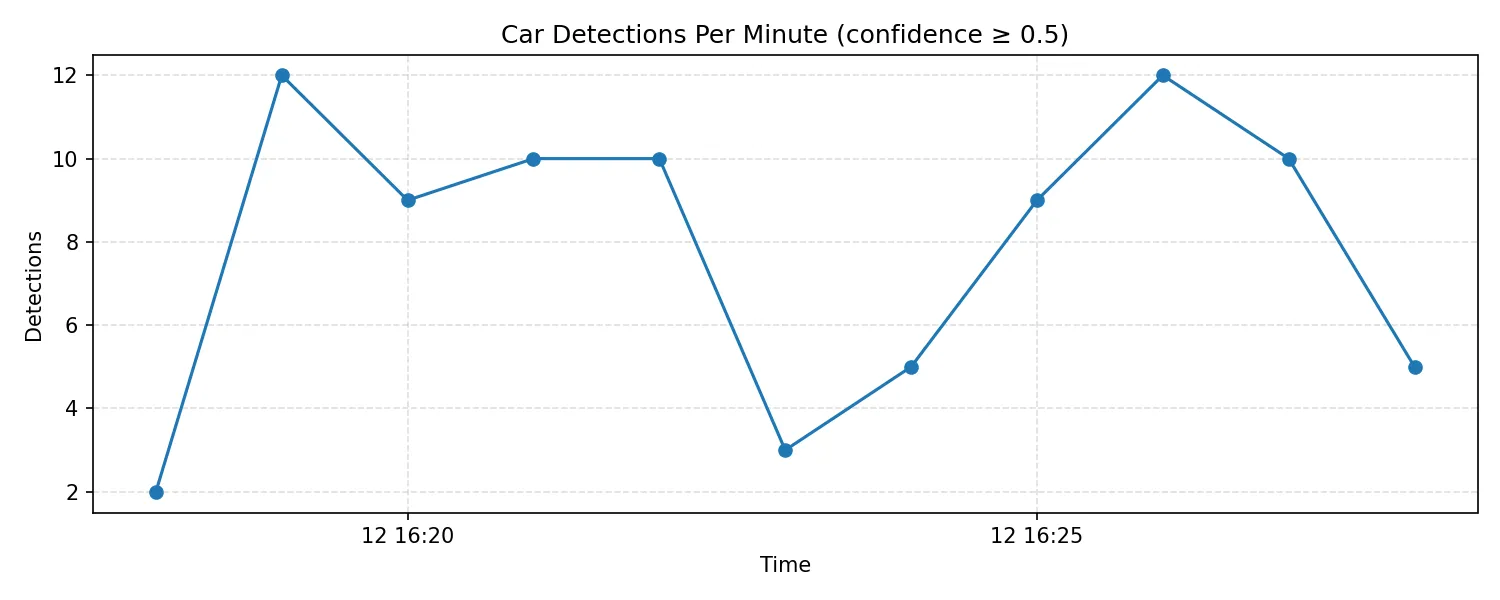
I believe this can be fixed with additional iterations. However, because per-car confidence was often low (frequently below 0.5), I plan to invest in an “AI camera” or an “AI HAT+ 2” and repeat the task to improve detection confidence. I also asked for a graph showing car detections per minute during a 10-minute test.
Score: 2/5
7. Traffic Monitoring — car noise detection
Since the object detection wasn’t giving me good results, I decided to try another approach — detecting passing cars using a microphone.
Microphone specs:
- Frequency response range: 50–16000 Hz
- Mic size: 6.0×2.7 mm
- Sensitivity: −46 dB (0 dB = 1 V/µbar, f = 1 kHz)
- Polar pattern: omnidirectional
- USB type: USB 2.0 / V1.1
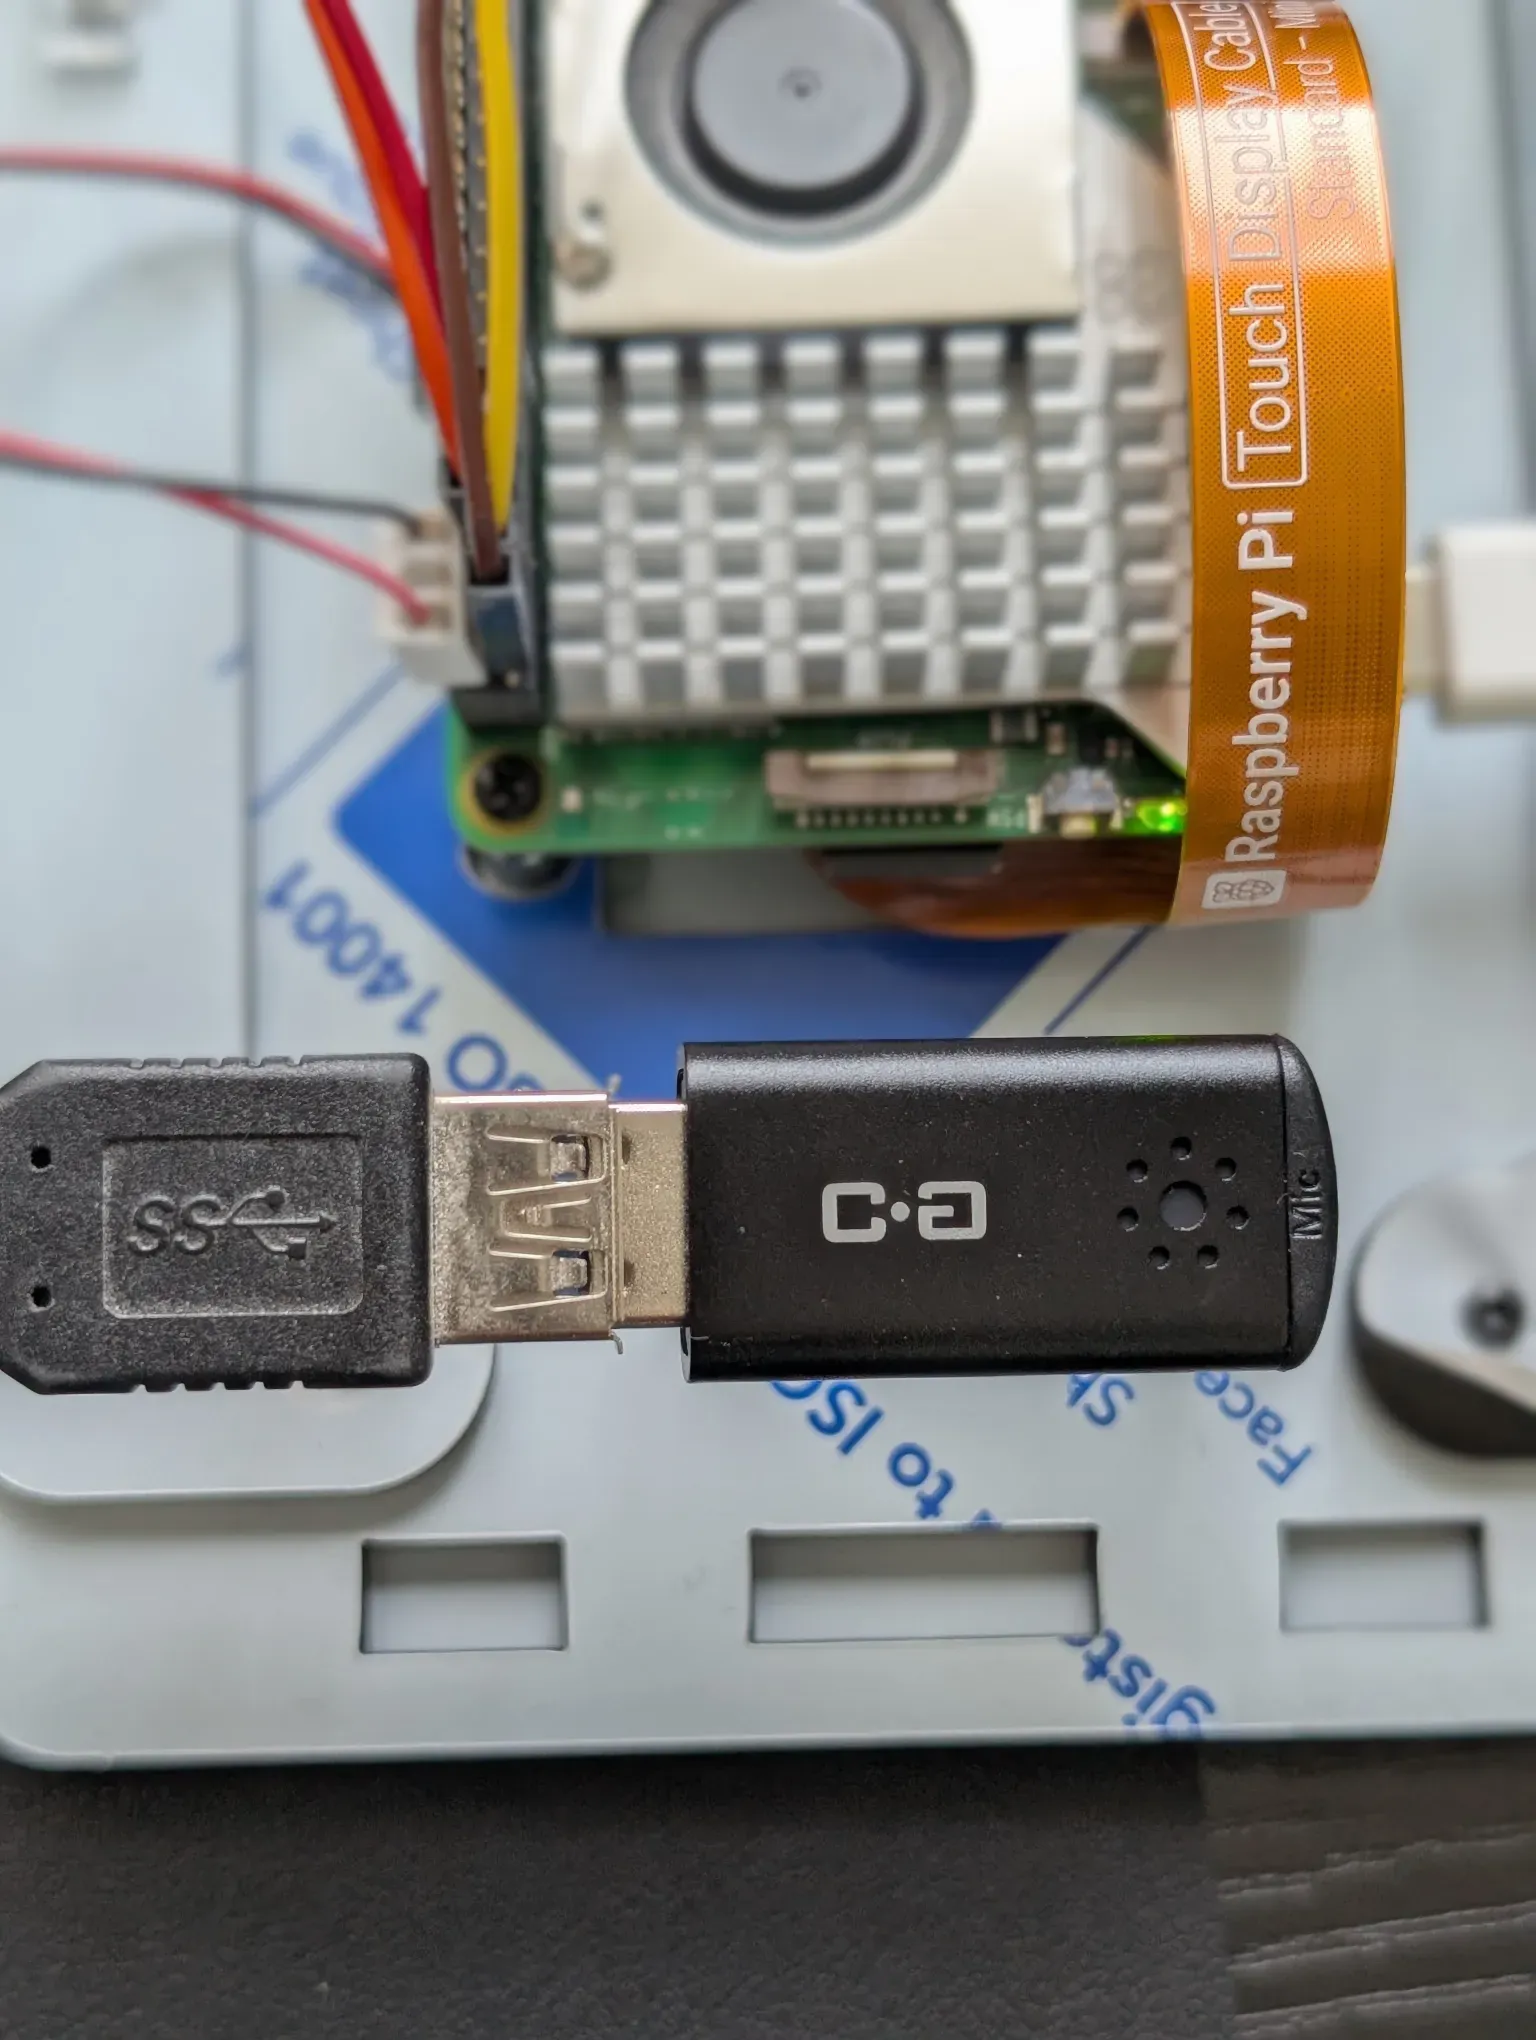
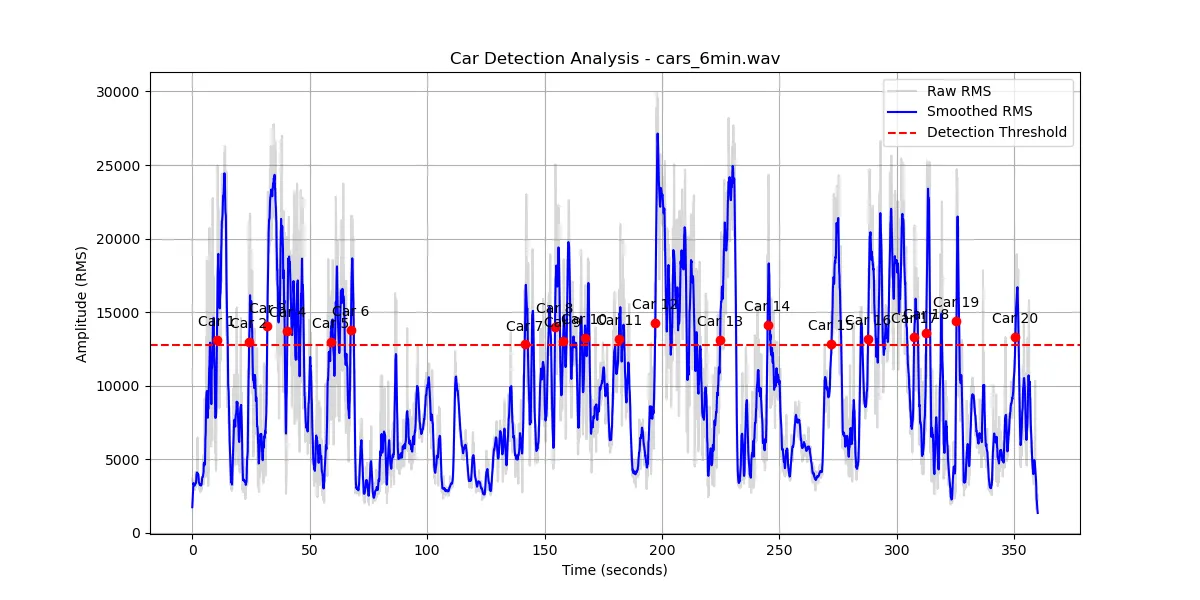
I asked the assistant to run detection for a few minutes while I counted the cars manually, then compared the results. It took only one tuning attempt to reach about 90% accuracy, which remained consistent across three additional tests. It even detected two cars that were very close to each other — something I expected it to struggle with. In one test I could hear a small airplane fly over the microphone, but the system did not classify that sound as a car.
Each detection produces a .wav file and triggers a Python script that generates an amplitude graph along with a JSON file containing the detection characteristics we agreed on during development.
Some limitations
- Weather conditions — this setup works well only if there is no rain or strong wind.
- No live detection — this approach does not allow real-time detection.
- False positives — if a car enters or leaves a driveway in the neighborhood, it might be mistakenly detected as a passing car.
Score: 4/5
8. Total cost
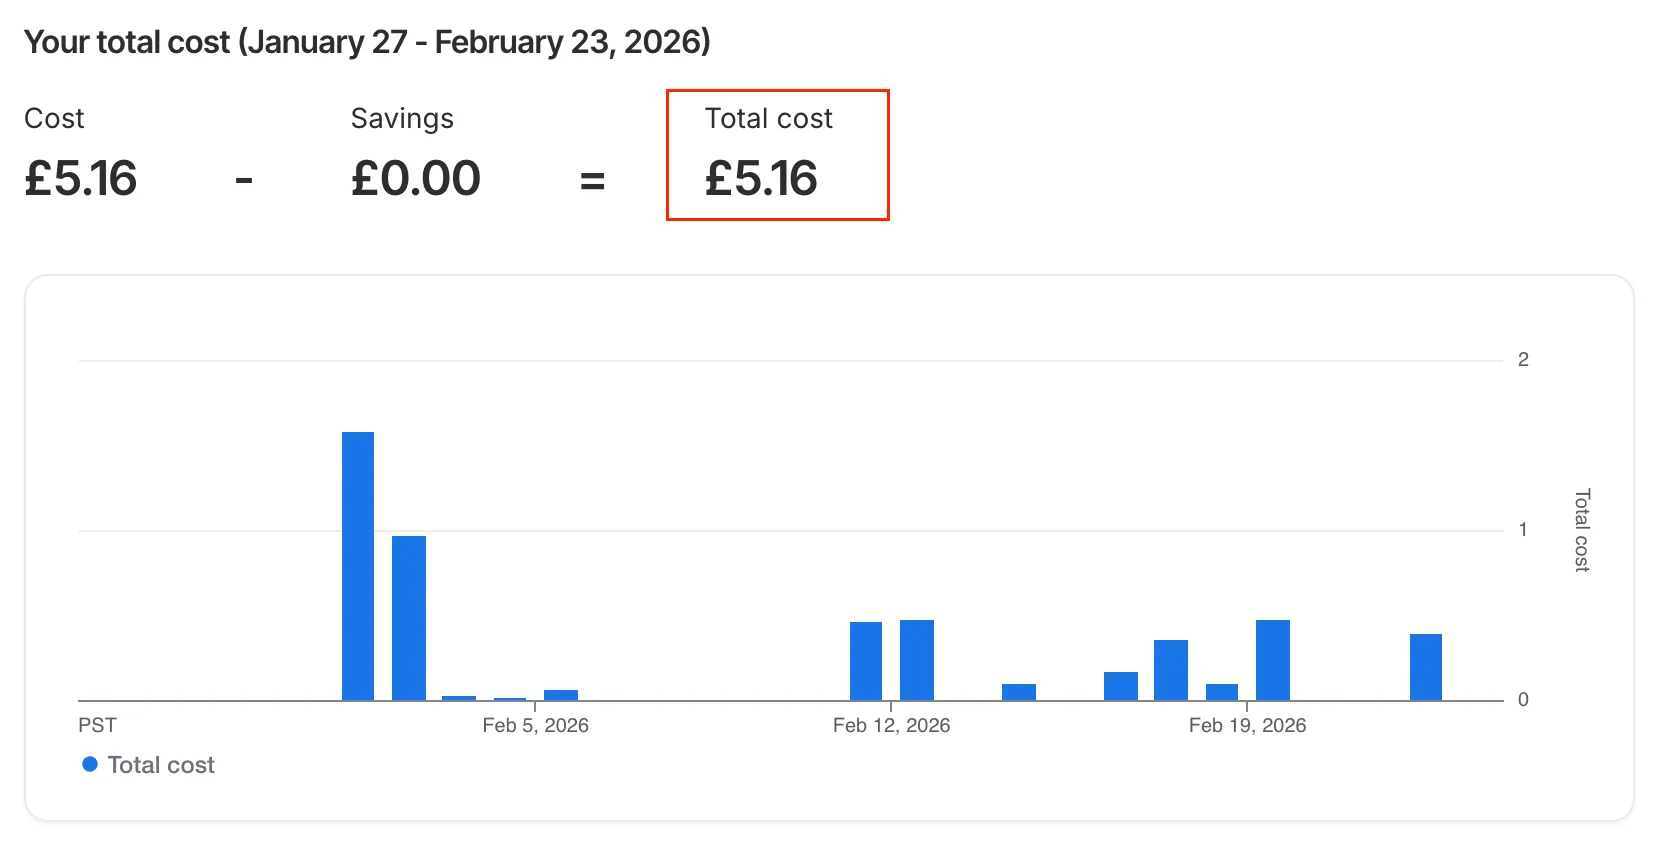
I used the most affordable Gemini model available at the time, which cost me £5.16 in total. While a higher-end model might enhance the test results, I am pleased with the current outcomes and intend to use more expensive models for more complex tasks.
9. Stability
During my testing I had only one instance where I had to restart the session. Apart from that, OpenClaw on the RP5 was very stable and I didn’t notice any issues.
10. Next steps
- Optimisation techniques
- Choose the right model for a task.
- Define
max_tokensfor completions and adjust dynamically based on the task. - Use batching and caching.
- Prompt engineering
- Use prompt templates.
- Give different roles for specific tasks.
- Break large requirements into smaller tasks.
- Think about the output format before prompting (JSON, CSV, text, etc.).
- Provide context and examples.
- Monitoring — track token consumption, errors, latency etc.
- Custom routing for cost saving.
- More IoT projects.
11. Conclusion
With the ability to attach various sensors, cameras and screens to the Raspberry Pi, you can do a wide range of projects. It easily connects to a Raspberry Pi Zero W or Pico 2 W, allowing tasks to run on those devices. You can offload CPU/GPU-intensive tasks to an AI HAT+ 2, which remains much cheaper than a MacBook Mini. If you make a mistake, simply swap the SD card and start over. If you have a Raspberry Pi available, I recommend installing OpenClaw and tackling a project you’ve been putting off.